Turn shopper behavior and unit economics into the next decision on every listing - content, price, ads spend, or where to invest next.
See where shoppers drop off
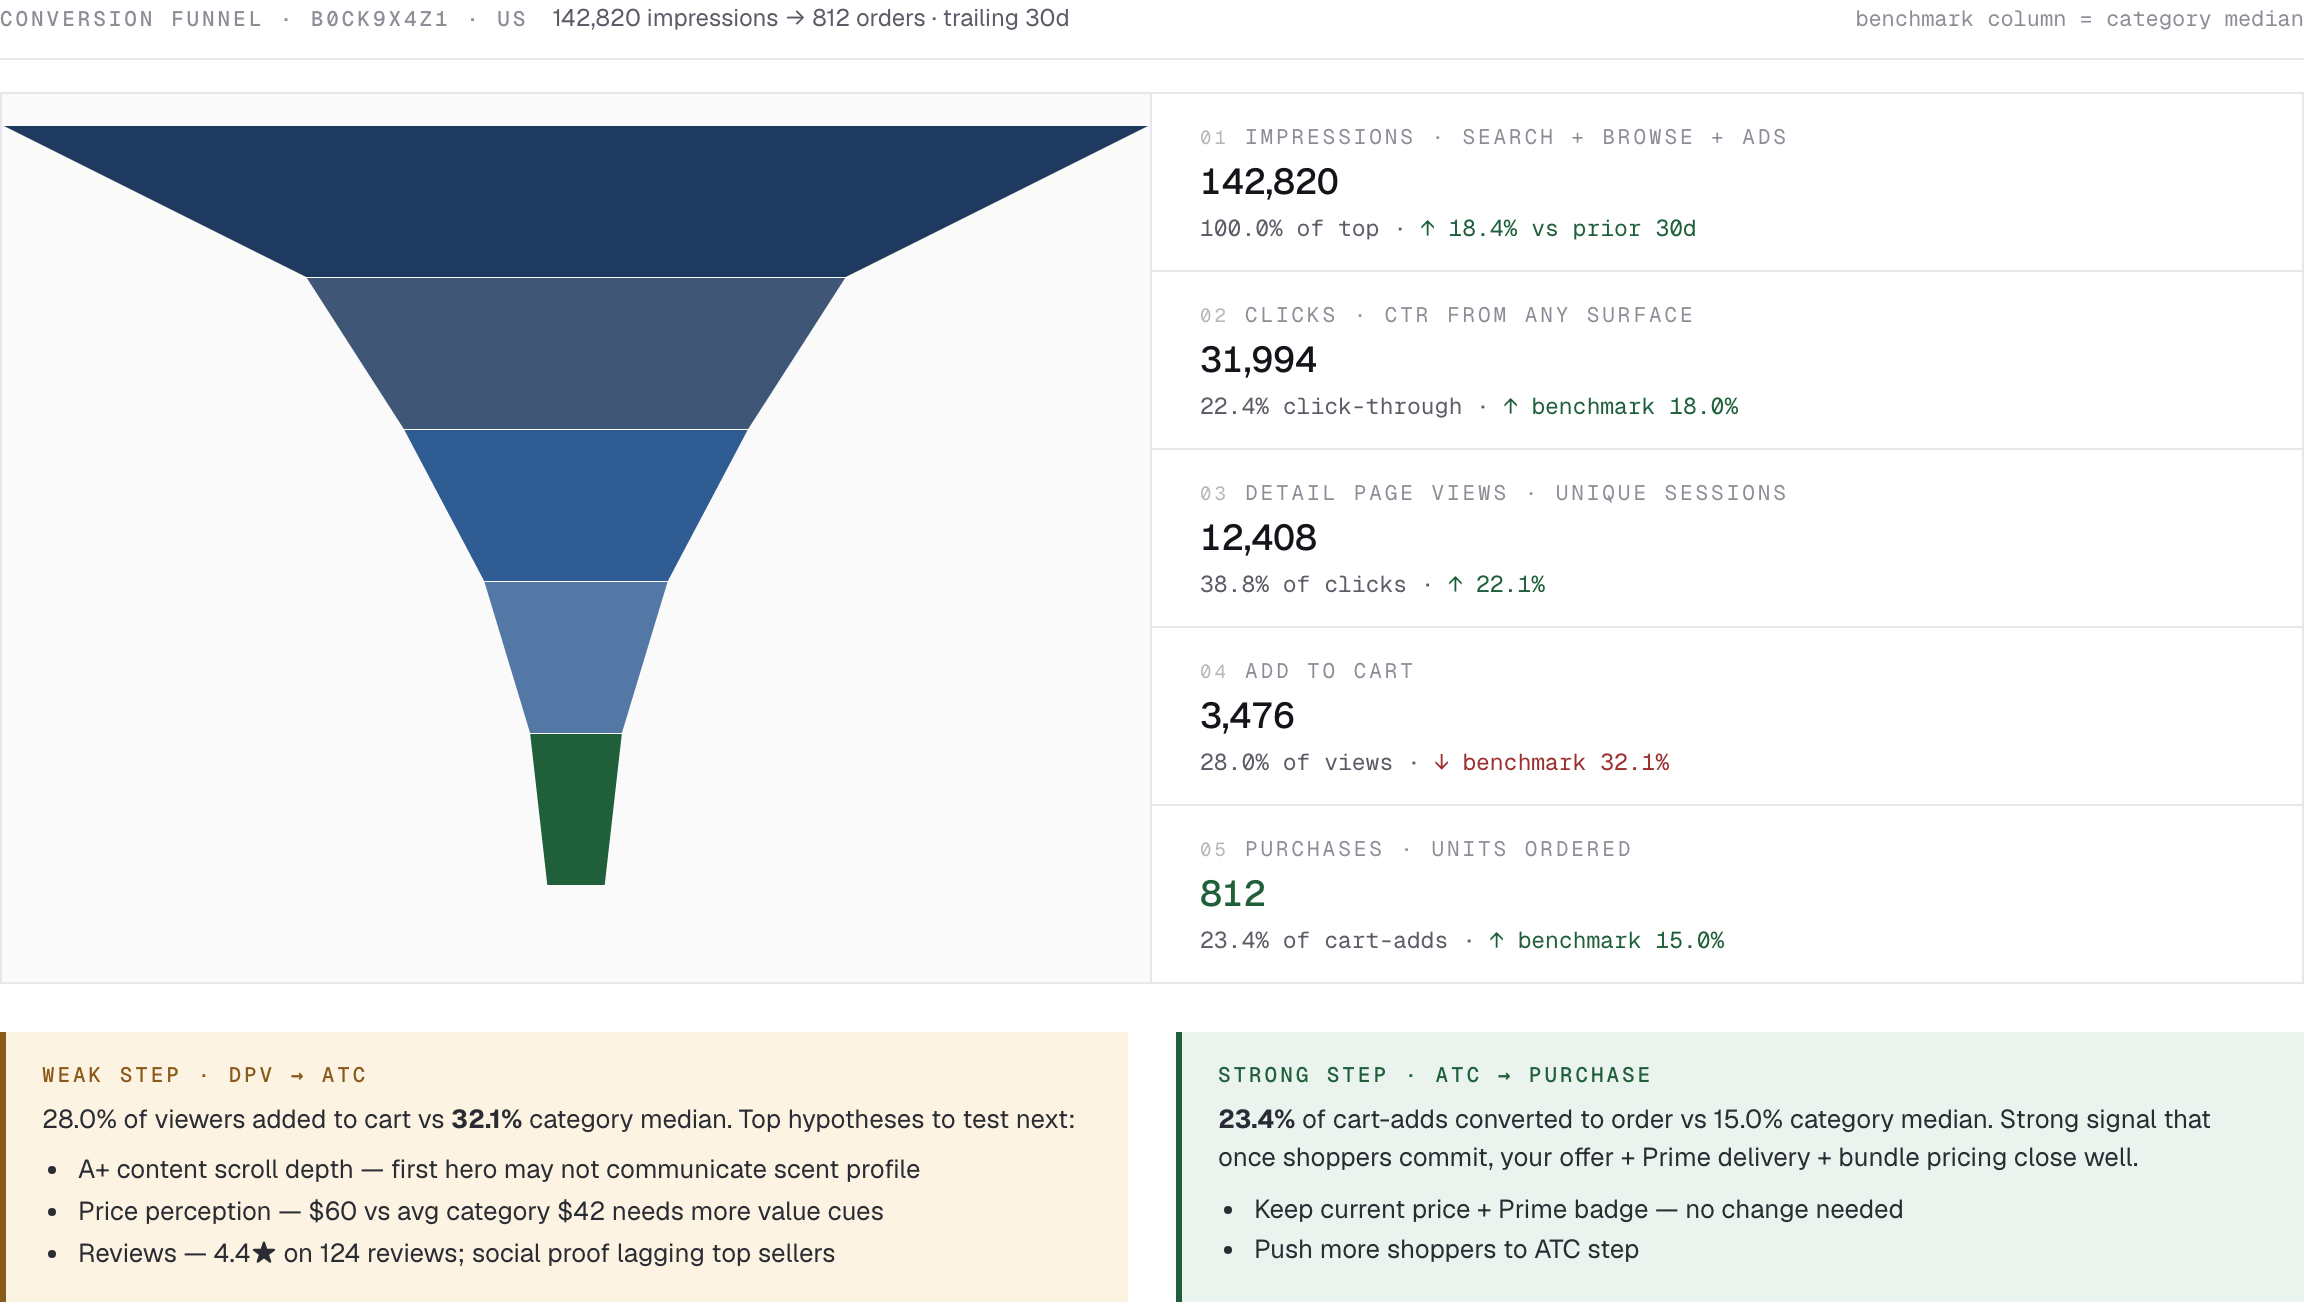
A complete view of the search-to-sale journey for every listing — impressions, clicks, page views, cart-adds, purchases. With category benchmarks at every step, you know exactly which stage to fix first.
5-stage funnel with category benchmarks
Drop-off explanations per stage
Hypotheses for what to test next
Know which terms drive your sales
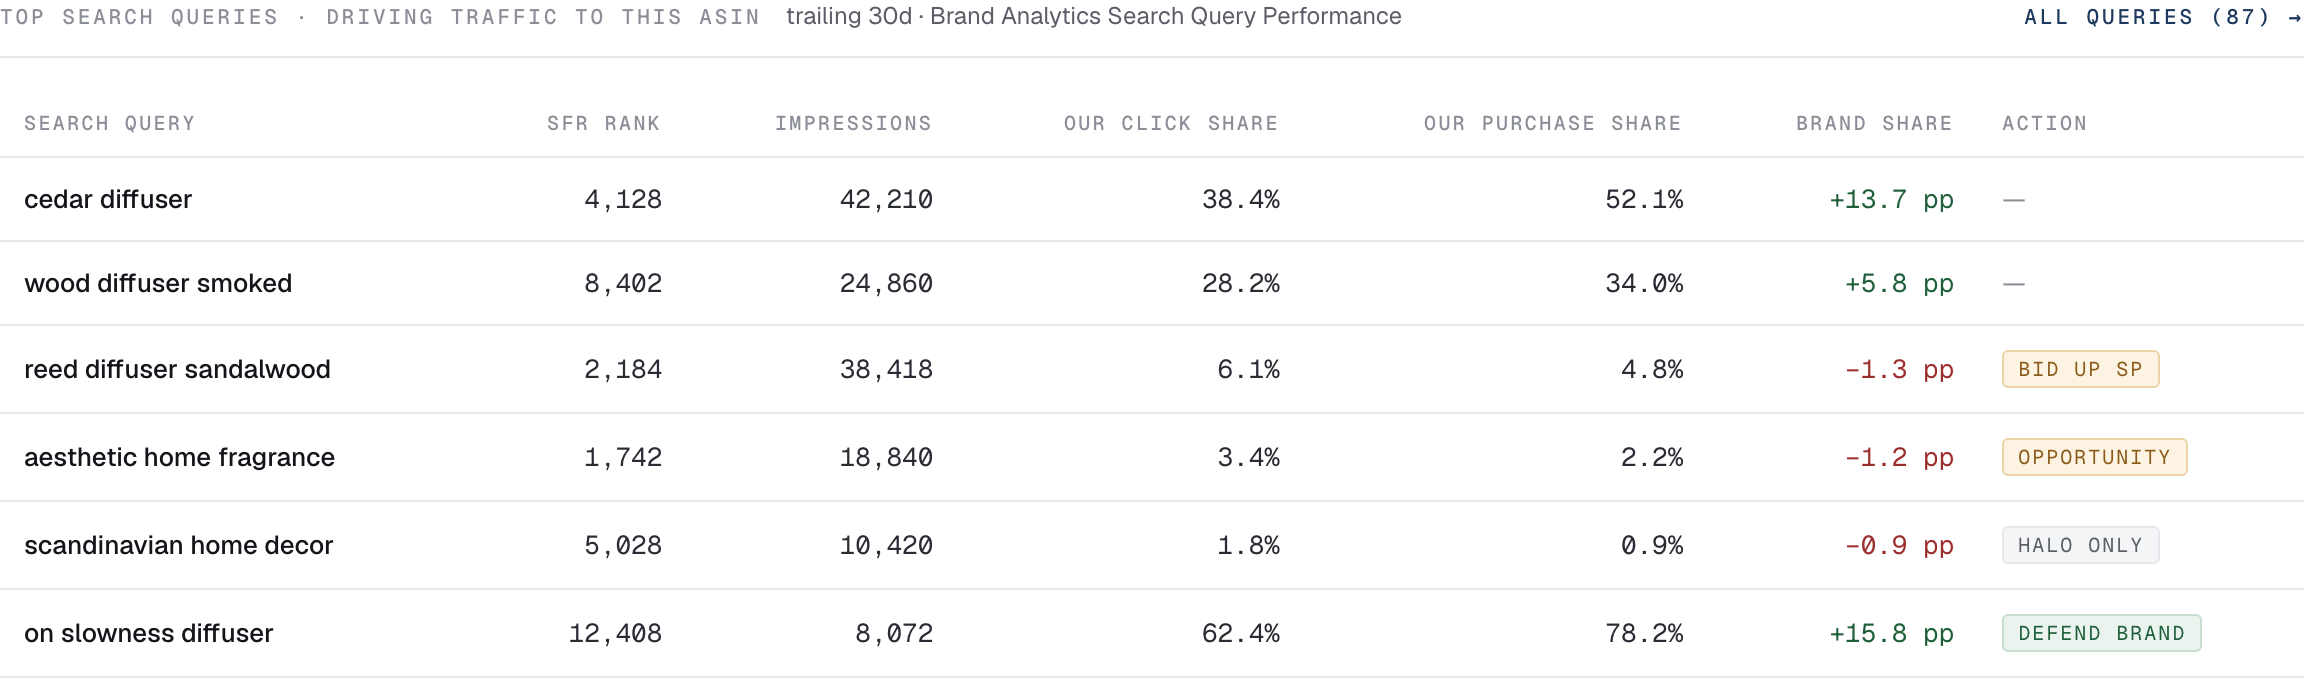
See the actual queries customers used to find each listing - including competitor branded terms - and your click share and purchase share for every query. Inputs the ads bid strategy and listing copy.
Search frequency rank per query
Click share & purchase share
Suggested bid actions
Understand every cost per unit
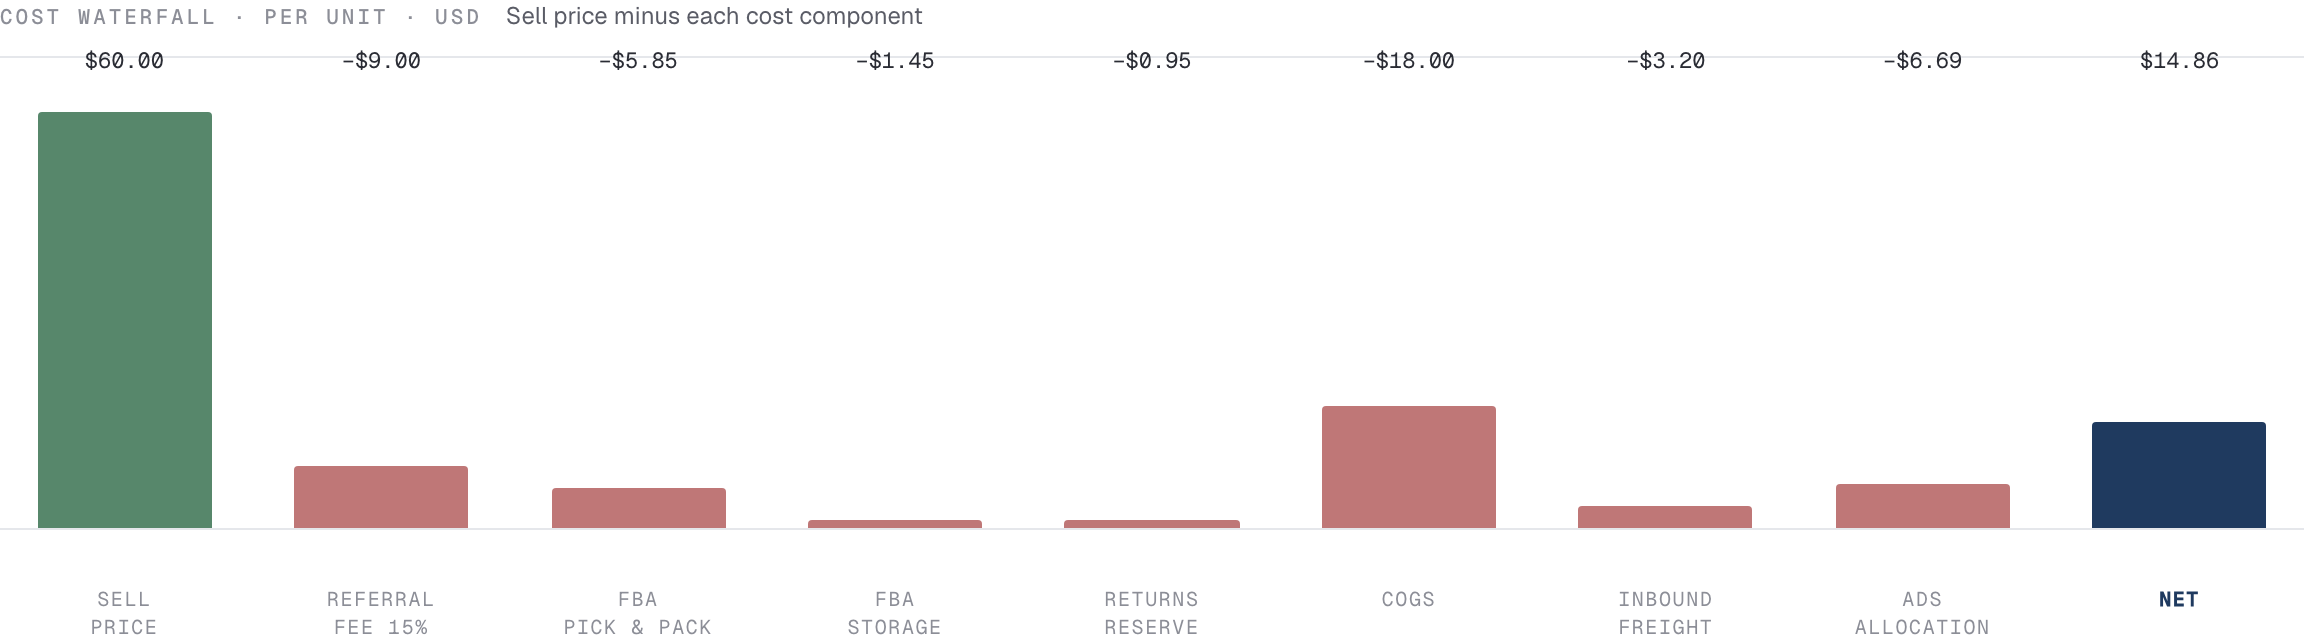
Sell price minus referral fee, FBA pick-and-pack, storage, returns reserve, COGS, freight, and ads - straight to net margin. Stitched from SP-API, Ads API, and your PO history. No spreadsheets.
8-step waterfall per unit
Per-unit and 30d totals
Allocated ads via halo model
Test changes before you make them
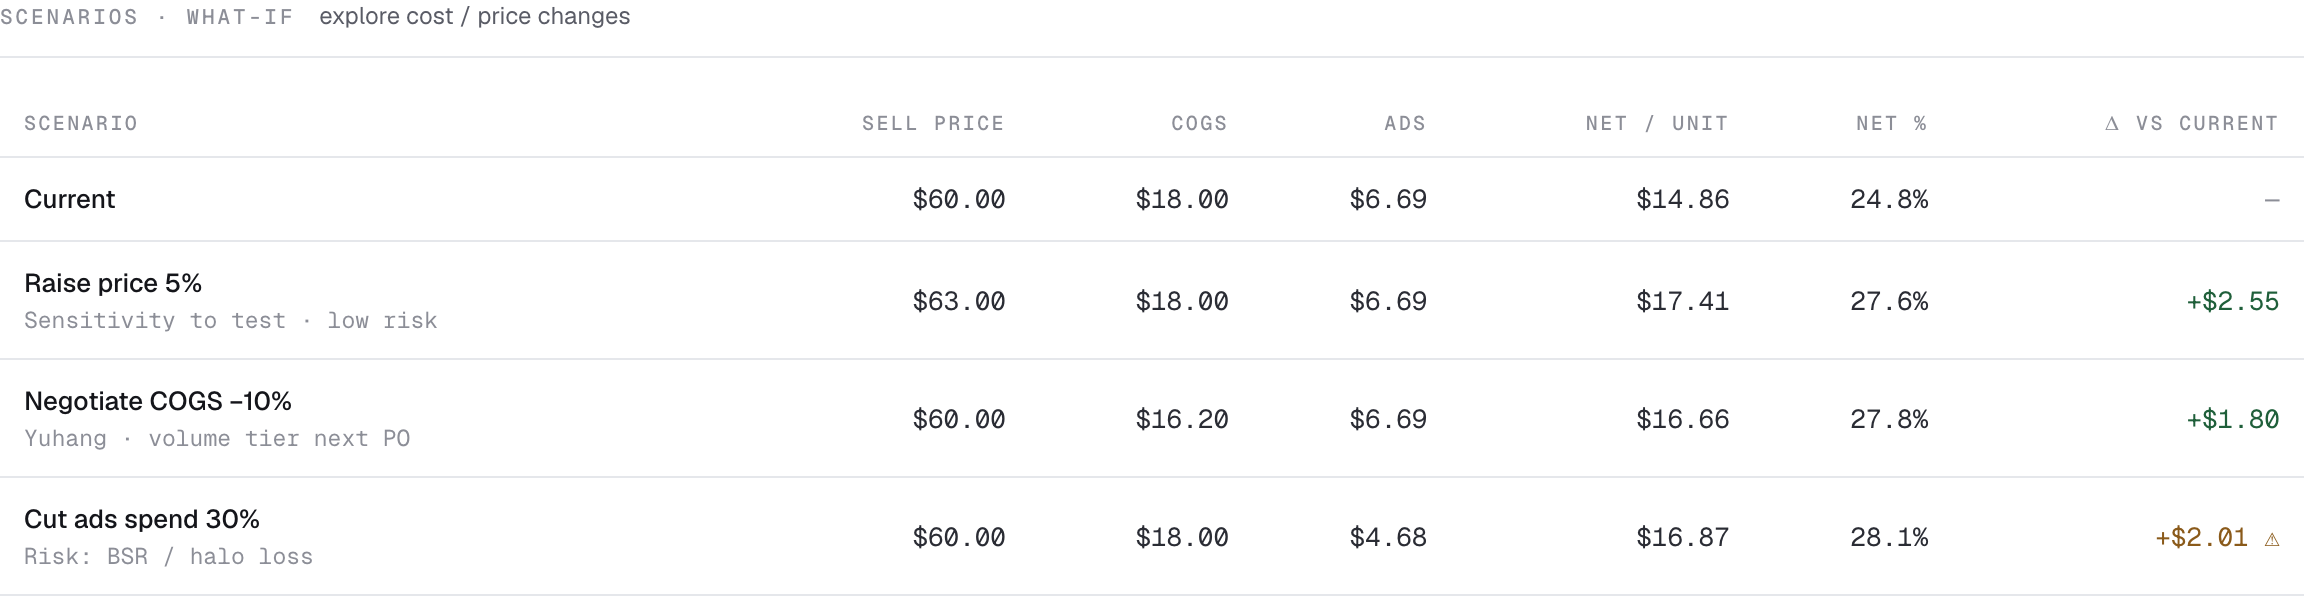
Model the impact of a price bump, a COGS negotiation, or an ads spend cut — see the net margin delta on the same canvas. Make pricing and supplier decisions on data, not gut.
Every Amazon marketplace in one canvas. Spot accelerating markets, slowing ASINs, and ads inefficiencies — without flipping between Seller Central tabs.
All your markets in one view
Revenue, units, AOV, and net margin across every Amazon marketplace - USD-normalised at month-average FX. Compared against the prior period to surface what's working and what's slipping.
Multi-currency normalisation
Period-over-period deltas
Realtime SP-API data
Compare markets side by side
Revenue, ACoS, units, and 8-week trend sparklines for every marketplace in one table. Instantly spot which markets are accelerating, which are slowing, and which are at risk.
Per-market trend sparkline
Δ vs prior period
ACoS in same view
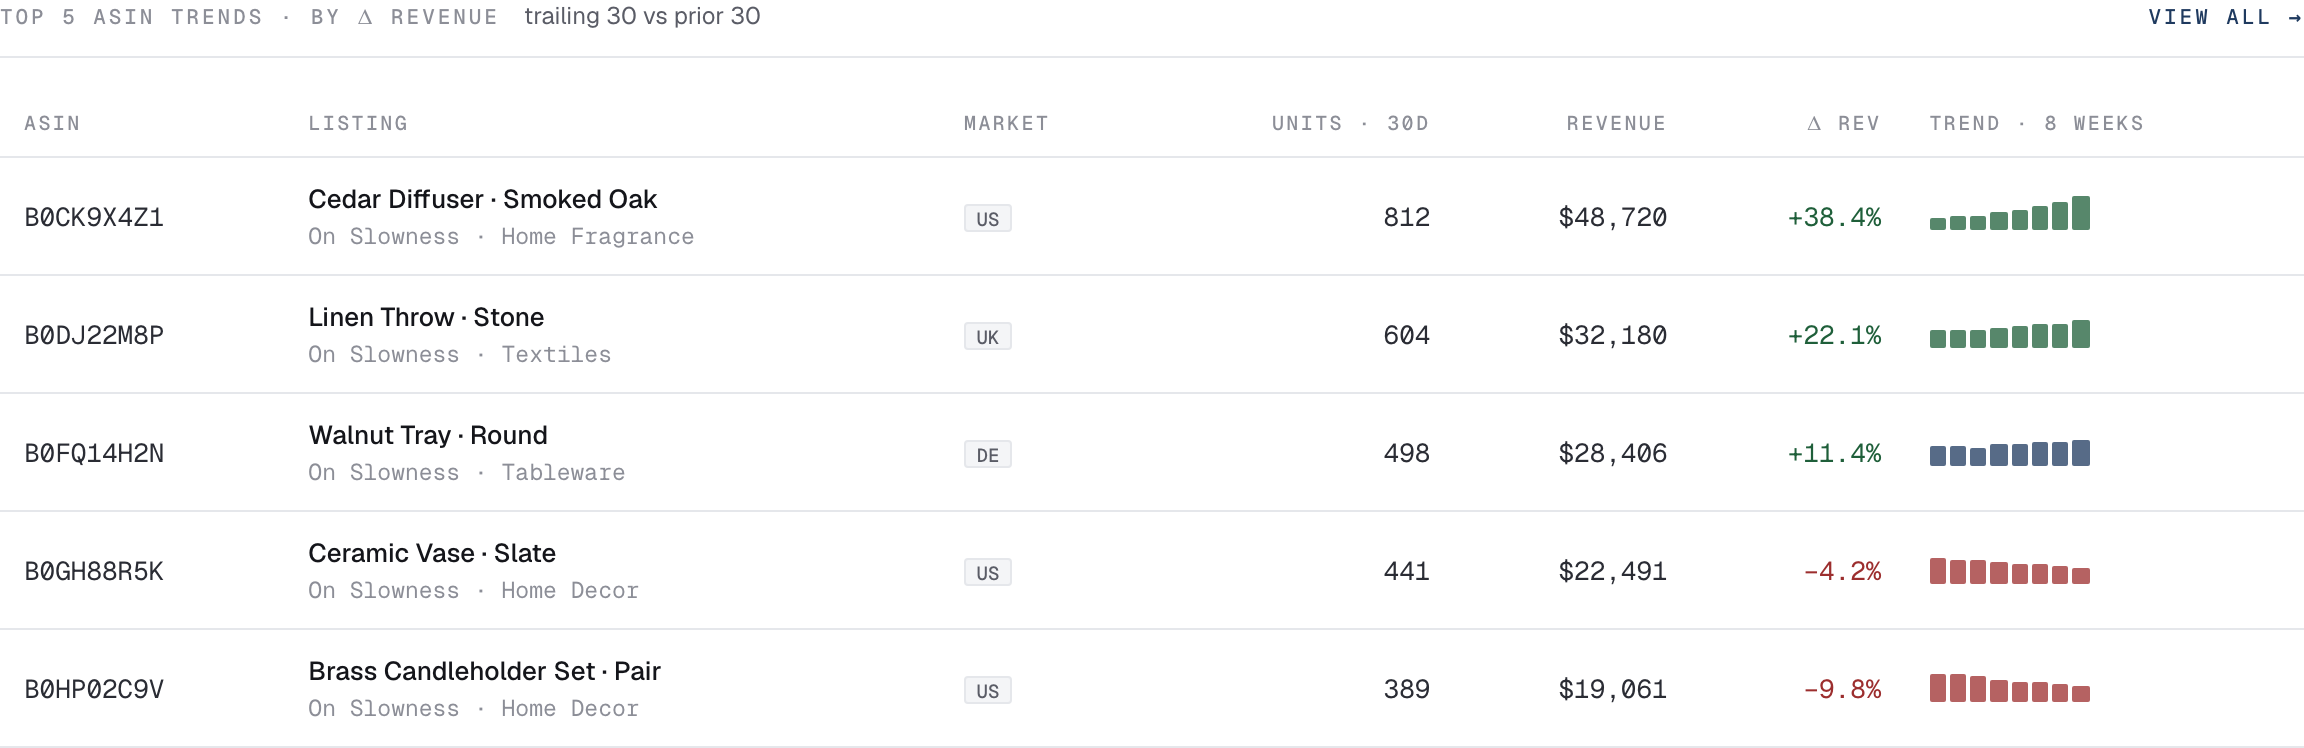
Spot winners and losers fast
Your top ASINs by revenue change, with 8-week trend sparklines per listing. Stop chasing whether last week's spike is a real trend or noise - see the trajectory at a glance.